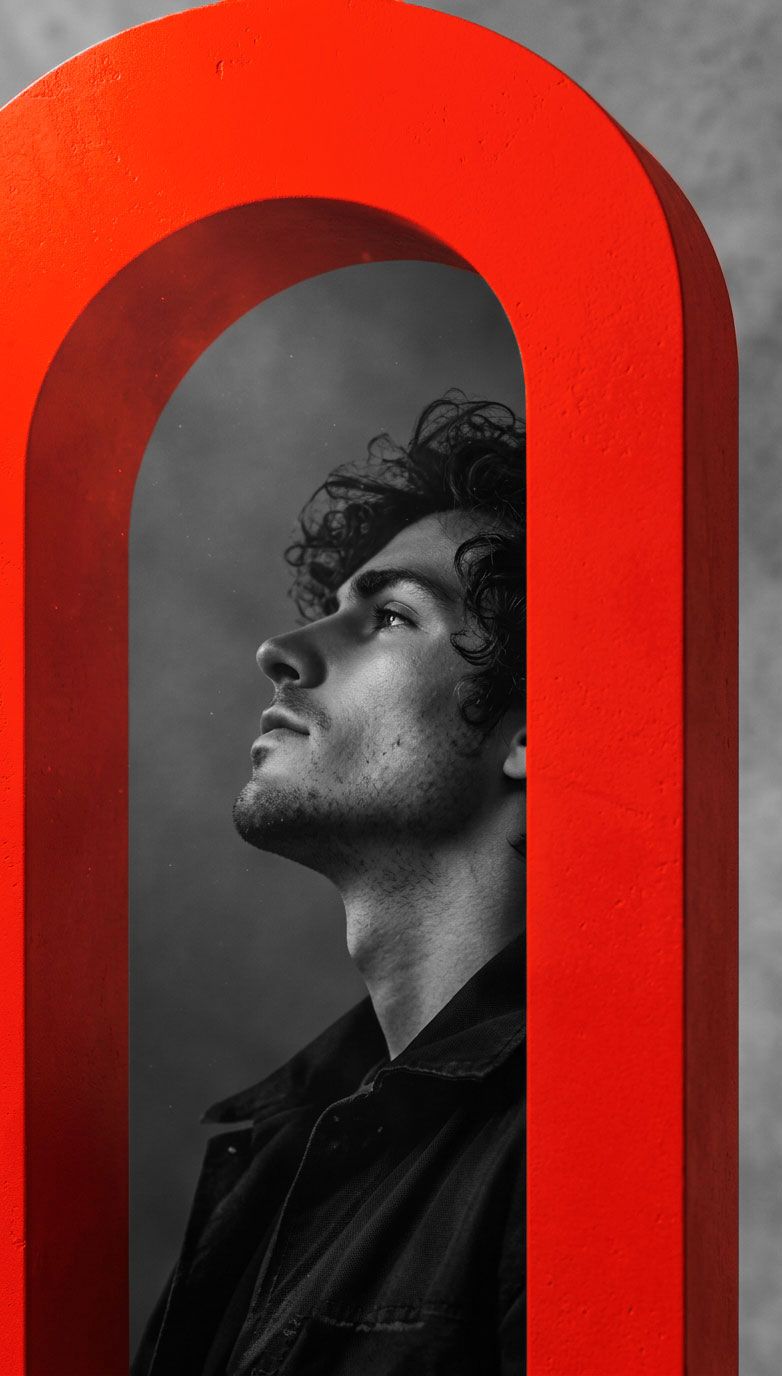
Your thumbnail decides whether the video exists.
The thumbnail is the first thing your audience sees, and it decides whether your video gets the click. Thumbiq analyzes every variable with a published academic model and proprietary metrics — measurable criteria, not hunches.
per asset


The problem isn't the content. It's the front door.
Most channels between 20K and 300K subscribers publish consistently but don't grow at the pace they should. The bottleneck is almost always the same.
Thumbiq turns those three variables into measurable scores. You know exactly what's failing and what to change first.
Thumbnails by intuition
Visual decisions with no criterion you can measure or repeat.
Titles with too many topics
Scattered topics and a neutral tone that dilute the video's promise.
Descriptions with no structure
No keywords, timestamps or CTAs to back up the click.
The system automatically detects the asset's format and recalibrates how each variable is read for that format, without altering the model's coefficients.
What we measure — and why it matters.
Five measurement systems covering the image, the title and the description. Every recommendation comes with a measurable reason behind it.
Global ELM Score
The Elaboration Likelihood Model applied to thumbnails: element and object complexity, recognizable figure, color, brightness and image quality.
See ELM analysisClickability Index
Six dimensions that explain why someone clicks.
See the 6 dimensionsTitle Analysis
Topic entropy, positive or negative emotional charge, and cluster classification.
D Score
Relevance, keywords, structure, engagement and context in a single figure.
Creative Distance (CDI)
How far from the obvious the idea goes — and how quickly it is understood.
See CDIEvery format reads differently.
The system detects the asset's format and recalibrates how each variable is read, without altering the model's coefficients.
 Detected
Reactions, interviews, vlogs with a host.

Reviews, unboxings, sneakers, gadgets, fashion.
Rankings, debates, explainers and opinion.
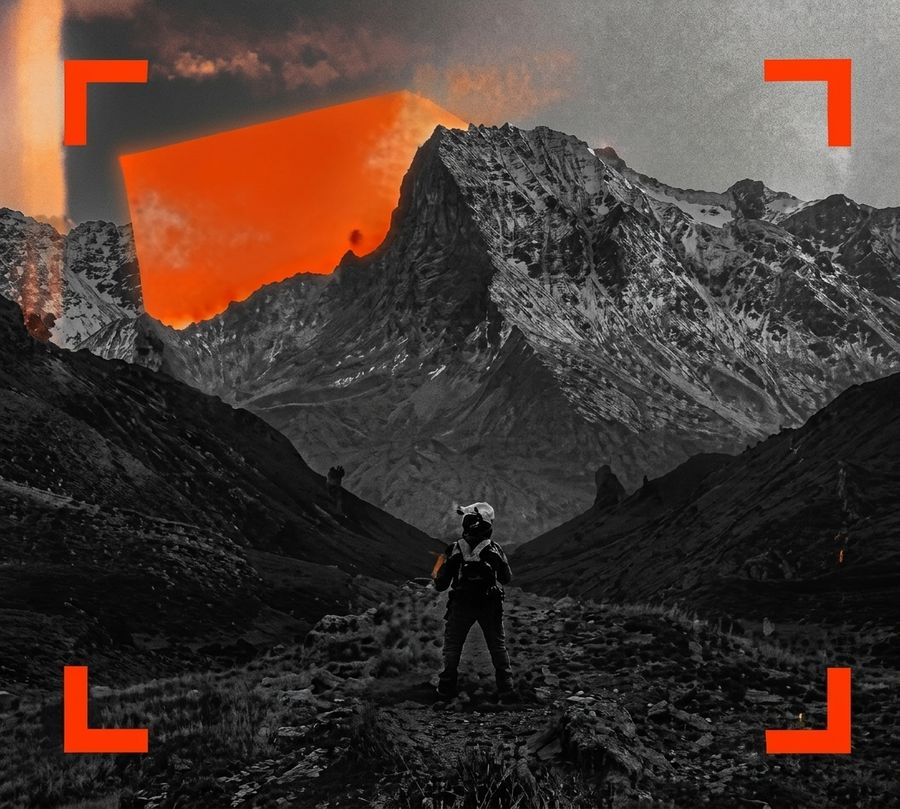
Travel, locations, experiences and events.
Simple. Fast. No unnecessary meetings.
You send us the asset by email. Within 48 hours you receive the full PDF report with scores, diagnosis and recommendations ready to apply. No forms, no long onboarding.
You send thumbnail + title + description
A JPG or PNG and the video title. The description is optional but recommended.
✉ contacto@thumbiq.ioWe apply ELM + Clickability + D Score
Image metrics calculated from the pixels and explicit criteria for every variable.
◎ Published academic modelYou get the report with the 3 highest-impact actions
Prioritized by impact, with the measurable reason behind each one.
⏱ Delivered within 48 hoursA report that tells you what to change first.
- Global ELM Score and every model variable
- Clickability Index in 6 dimensions
- Title: complexity, tone, cluster and coherence
- Description D Score
- Recommendations prioritized by impact
Try the analysis for free.
For channels that want to try it before committing. Also for high-stakes videos, launches and pilot episodes.
What's included
- Full PDF report (up to 16 pages)
- Global ELM Score + variables
- Clickability Index (6 dimensions)
- Title and Description analysis
- CDI, when the asset calls for it
- 3 prioritized recommendations
- Delivered within 48 hours
Frequently asked questions.
About the process, the deliverables or how the model works. If you can't find what you're looking for, write to us.
What do I need to send for the analysis?
Does the report work for any YouTube niche?
How is this different from other thumbnail services?
What if my thumbnail has no person in it (products, rankings, travel)?
What is the Creative Distance Index (CDI)?
Better thumbnails. Better results.
Know what is failing in your thumbnail and what to change first, before you publish your next video.